Note: This post describes an extension to Prometheus that is unlikely to ever make it upstream, and definitely not in its current form.
Time Series Indexing
When we talk about an index for a time-series database, we are usually talking about an index of the metadata. In the case of Prometheus, such an index would help us locate all the series with certain labels, allowing us to quickly query, for example, all the http_requests_total timeseries that match a given handler or response code. Whilst that is a worthy topic to explore, this article is not about that.
Most timeseries databases we deal with will not attempt to index the actual data. It is rare to want to search based on values. This is especially true when data is stored using floating point, or is derived from fast changing counters. Searching for an exact float64 value is of limited use. Even searching specific numbers within a known range is not that useful. Traditional indexing methods are just not of much interest for the time series data itself.
Finding signals in the noise
Whilst it’s rare to want to find a specific value in our data, it’s not uncommon to want to find correlations between time-series. “Who is doing that?!”, is a not uncommon refrain from the desperate systems or network administrator. Correlation does not imply causation, but it can get the witch hunt off to a good start.
I often found myself in this situation when working as a network administrator on a medium sized office and data-center network in a previous role. The total estate consisted of several dozen high density switches, totalling a few thousand ports. It was not uncommon for a single user to monopolise the, relatively small, central office Internet pipe. Finding which one of the many 1Gb/s ports was originating the 40Mb/s spike was tedious, and usually involved scrolling through pages of cacti graphs to locate the floor and port responsible.
It seemed that it should be possible to find graphs that contained features with a passing resemblance to the problematic spike. My manual search was really the search to answer the question of “Which graph has a spike on it that looks a bit like the one on the Internet link?”. But can we get a computer to do this for us?
Feature space reduction
Unsurprisingly, many greater minds than mine had expended much effort to solve this problem (though, none that I know of, were hunting for rouge BitTorrent users).
The answer lies in a set of techniques called Dimensionality Reduction. The key is to convert our time series data from its initial state, which we’ll call temporal space, to something called a Feature Space. Feature Spaces represent features of the data, rather than the specific data samples themselves. Once converted, we effectively reduce the resolution of the data in the feature space, allowing us to compare the features, rather than the raw data. Such, comparisons can be much “fuzzier” than attempts to search for pattterns in raw data.
The best known example of a feature-space conversion is the Fourier Transform and its variants (DCTs, and wavelet transforms for example). Rather than represent the time series data as a series of values in the time domain, these tell us which frequencies are present in the data. These frequencies are the features.
The broad idea is to convert our time series data into some other form that more directly represents the features, then compare those features for the similarities we are interested in. Once we are working in feature space we can apply techniques such as Euclidian Distance and Nearest Neighbour searches, to locate other series whose data has similar features to ours.
As tantalising as the frequency domain conversions are, it turns out that some of their properties make them less ideal for correlation of spiky network traffic. In particular, a small shift of a spike of traffic in the temporal space (appearing very slightly earlier or later in one graph from another), can result in very different frequency domain data. Small square spikes generally don’t encode well to frequency domain. Such spikes are common in network monitoring data.
The SAX project came up with an alternative approach which is easy to understand, and very easy to implement.
Piece-wise Aggregate Approximation
The process is straight forward:
- Downsample the data to a convenient number of samples. Typically 6 to 8 are enough.
- Normalize this downsampled data (usually z-Normalization).
- Quantize the resulting data into a set of ranges (typically 8).
- Assign a letter to each quantized value.
The resulting string encodes the shape of the time series data. Any two time series with the same final string encoding will have a similar shape. The SAX and ISAX2 papers give some example values for the quantization bands they found effective.
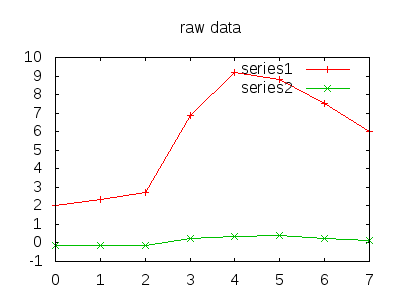
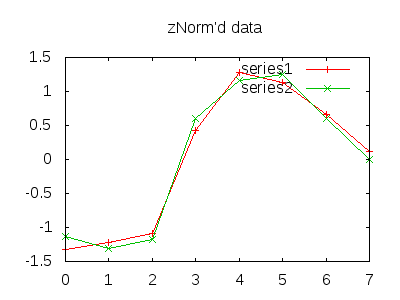
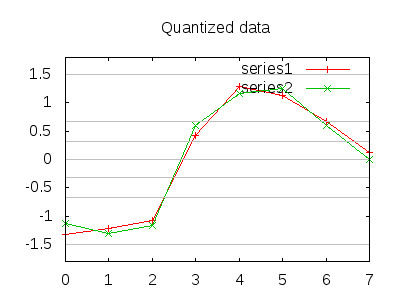
This is easier to visualize. The example data is blatantly rigged for demonstrative purposes. (We assume downsampling has already occurred).


For each quantized value we assign a letter, A for the lowest band, H for the highest, in the example (rather conveniently), both would encode to “BBBFGGFE”. In practice, many of the spikes, errors, or drop offs in traffic result in drop and jumps in traffic that correlate well.
After some experimentation I eventually implemented, and successfully used this technique using a tool called lookalike, developed for Cacti.
I toyed with ideas for implementing a similar solution for OpenTSDB and InfluxDB, but neither had internals that made it particularly easy (the latter used a map/reduce model internally that proved tricky, the former is written in java).
Prometheus Implementation
Whilst Prometheus does not support string data for values, float64 does give us plenty of room to pack in a PAA encoding. 8 3-bit samples were generally sufficient for a reasonable match in lookalike. We can store 52 bit integers exactly in a float64, which is far more space than the 24-bits we require.
Prometheus is essentially an in-memory time series database with support for spilling out to disk. This has the advantage that all the data is easily available when an internal function executes.
Prometheus has no internal support for downsampling, so this needed to be done within the function (Lookalike used the inherent downsampling of an RRD file). For Prometheus I opted to implement Least-Triangle-Three-Bucket. This was largely chosen because it seemed interesting, and there is a somewhat “visual” component to what PAA is trying to do. LTTB attempts to maintain the visual aspects of downsampled data for display purposes. In practice, the technique is expensive and simpler methods should be tried for comparison.
The process is PAA adjusted as follows:
- LTTB Downsample the data to 8 samples.
- z-Normalize this downsampled data.
- Quantize the resulting data.
- Take each 3 bit sample and pack into a single integer
- Convert that integer to a float64
Usage
The paa() function takes a range vector and returns an instant vector. The actual value returned is not of much use directly.
Using the function is rather clumsy. By convention, Prometheus functions that alter the meaning of the data they process remove the metric name, which makes determining what has matched a bit tricky (label_replace tricks can be used to store the original name on a label, I’ve left such magic out of the examples for the sake of clarity).
To calculate a single PAA for the all time series for the last 15 minutes:
paa({__name__=~".+"}[15m])
If we want to find all time series that correlate with our network traffic on eth0:
paa({__name__=~".+"}[15m])
==
paa(task:node_network_transmit_bytes:rate1m{device="eth0"}[15m])
We can establish recording rules that will track the PAA for a 15m window of network traffic:
task:node_network_receive_bytes:paa15m_rate1m =
  paa(task:node_network_receieve_bytes:rate1m[15m])
task:node_network_transmit_bytes:paa15m_rate1m =
  paa(task:node_network_transmit_bytes:rate1m[15m])
If we want to find all network interfaces transmitting traffic that correlates strongly with traffic received at myhost eth1):
task:node_network_transmit_bytes:paa15m_rate1m
==
task:node_network_receive_bytes:paa15m_rate1m{instance="myhost",device="eth1"}
Since this is using pre-recorded values, the match does not need do do any calculation and should therefore be very fast indeed.
A Prometheus query_range over a time space around the point of interest should highlight all series which have matched the PAA over a period of time.
To be truely useful in practice more direct support for PAA would need adding to Prometheus.
Performance
Prometheus has excellent support internally for testing and benchmarking of its functions. Adding a couple of benchmarks shows paa() is well within the bounds of what is reasonable for a Prometheus function (though it is possible that the data generated by the benchmark suite is being very kind here).
I have left the results of the other Prometheus Benchmark functions in place for comparison purposes.
$ go test -v -bench=. -run=XXX 2> /dev/null                                            paa ]
BenchmarkHoltWinters4Week5Min-4             3000            369268 ns/op          986205 B/op        105 allocs/op
BenchmarkHoltWinters1Week5Min-4            10000            102932 ns/op          207921 B/op         89 allocs/op
BenchmarkHoltWinters1Day1Min-4             20000             76443 ns/op          146480 B/op         88 allocs/op
BenchmarkChanges1Day1Min-4                 30000             54977 ns/op          109584 B/op         83 allocs/op
BenchmarkPAA1Day1Min-4                     20000             61826 ns/op          109768 B/op         88 allocs/op
BenchmarkPAA15Min5Sec-4                   100000             17012 ns/op           14794 B/op         84 allocs/op
PASS
ok      github.com/Prometheus/Prometheus/promql 8.941s
Problems
In any sufficiently large environment, simple correlation will be fairly common. I found it useful in a system with hundreds of thousands of time-series, it may not prove so useful in environments with millions of time series. It seems likely that this is heavily dependent on the nature of the data being indexed.
The PAA itself is relatively hard work to calculate. In a large environment, calculating a PAA in a recording rule for a large number of time series will probably require considerable extra CPU, compared to typical rates or aggregates. However, since the usage and nature of the result is quite separate from data you might be graphing, it would not be unreasonable to have a separate instance purely for the purpose of indexing and searching.
Prometheus uses a double-delta encoding scheme for its internal and on-disk data storage. PAA values will not change “smoothly”, and are likely to stress the storage more than a regular time series.
The code does not gracefully handle NaN or Inf values in time series. Lookalike catered for this by adding an additional letter to the PAA representation that was used if a time series had no values in a given period. The downsampling function would need adjusting to take this into account, and the integer representation would need an extra bit per sample to allow such a representation.
I make no claim to any real expertise in this topic. I have gleaned what I could from papers written by those far more qualified than I, and applied it with a degree of success that could equally be attributable to blind luck. That being said, I had fun doing it, and my experience may be interesting, or enlightening, to others.
Conclusion
PAA is a simple and effective technique for time series indexing and searching. I’m satisfied that my naive implementation demonstrates that near-time indexing of streaming time-series data is practical.
The code implementing the feature can be see in this Pull Request. If you wish to try it out you can try the following:
$ mkdir -p ${GOPATH}/github/Prometheus/
$ cd ${GOPATH}/github/Prometheus/
$ git clone https://github.com/tcolgate/Prometheus.git
$ cd Prometheus
$ make
(Many thanks to Brian Brazil and Julius Volz for reviewing this post)


